Overview
Contents
Overview#
The library#
All functionality in xlandsat is available from the base namespace of the
xlandsat package. This means that you can access all of them with a
single import:
# xlandsat is usually imported as xls
import xlandsat as xls
Download a sample scene#
import pooch


path = pooch.retrieve(
      "doi:10.6084/m9.figshare.21665630.v1/cropped-after.tar.gz",
     known_hash="md5:4ae61a2d7a8b853c727c0c433680cece",
)
print(path)
/home/runner/.cache/pooch/7450bb0a799deea586280f7c3b539898-cropped-after.tar.gz
Load the scene#
scene = xls.load_scene(path)
scene
<xarray.Dataset>
Dimensions:   (northing: 300, easting: 400)
Coordinates:
  * easting   (easting) float64 5.844e+05 5.844e+05 ... 5.963e+05 5.964e+05
  * northing  (northing) float64 -2.223e+06 -2.223e+06 ... -2.232e+06 -2.232e+06
Data variables:
    blue      (northing, easting) float32 0.06148 0.06372 ... 0.06494 0.0663
    green     (northing, easting) float32 0.08244 0.08272 ... 0.08588 0.09022
    red       (northing, easting) float32 0.07258 0.0767 ... 0.08492 0.09184
    nir       (northing, easting) float32 0.2996 0.2772 0.2604 ... 0.2514 0.2467
    swir1     (northing, easting) float32 0.1907 0.1862 0.1572 ... 0.1828 0.2125
    swir2     (northing, easting) float32 0.1108 0.11 0.09312 ... 0.1167 0.1295
Attributes: (12/62)
    Conventions:                     CF-1.8
    title:                           Landsat 8 scene from 2019-01-30 (path/ro...
    origin:                          Image courtesy of the U.S. Geological Su...
    digital_object_identifier:       https://doi.org/10.5066/P9OGBGM6
    landsat_product_id:              LC08_L2SP_218074_20190130_20200829_02_T1
    processing_level:                L2SP
    ...                              ...
    temperature_mult_band_st_b10:    0.00341802
    temperature_add_band_st_b10:     149.0
    reflectance_mult_band_8:         2e-05
    reflectance_mult_band_9:         2e-05
    reflectance_add_band_8:          -0.1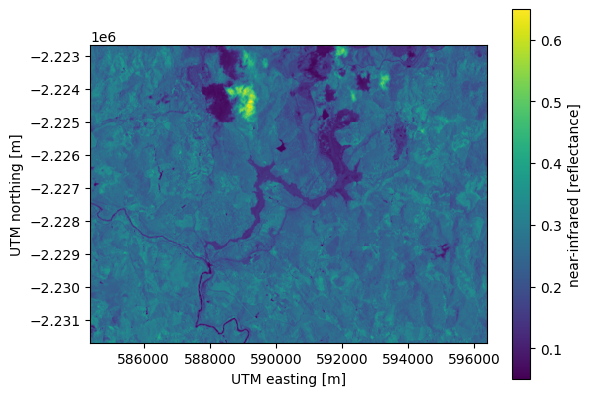
reflectance_add_band_9: -0.1Plot some bands#
import matplotlib.pyplot as plt


scene.nir.plot()
plt.axis("scaled")
plt.show()
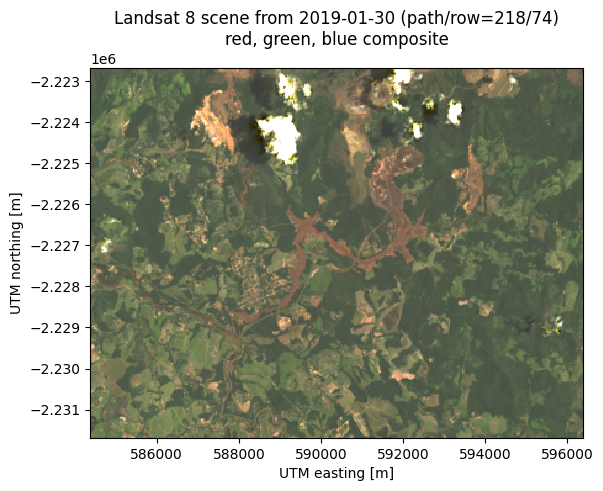
Make a composite#
composite = xls.composite(scene, rescale_to=[0, 0.2])
scene = scene.assign(rgb=composite)
scene
<xarray.Dataset>
Dimensions:   (northing: 300, easting: 400, channel: 4)
Coordinates:
  * easting   (easting) float64 5.844e+05 5.844e+05 ... 5.963e+05 5.964e+05
  * northing  (northing) float64 -2.223e+06 -2.223e+06 ... -2.232e+06 -2.232e+06
  * channel   (channel) <U5 'red' 'green' 'blue' 'alpha'
Data variables:
    blue      (northing, easting) float32 0.06148 0.06372 ... 0.06494 0.0663
    green     (northing, easting) float32 0.08244 0.08272 ... 0.08588 0.09022
    red       (northing, easting) float32 0.07258 0.0767 ... 0.08492 0.09184
    nir       (northing, easting) float32 0.2996 0.2772 0.2604 ... 0.2514 0.2467
    swir1     (northing, easting) float32 0.1907 0.1862 0.1572 ... 0.1828 0.2125
    swir2     (northing, easting) float32 0.1108 0.11 0.09312 ... 0.1167 0.1295
    rgb       (northing, easting, channel) uint8 92 105 78 255 ... 115 84 255
Attributes: (12/62)
    Conventions:                     CF-1.8
    title:                           Landsat 8 scene from 2019-01-30 (path/ro...
    origin:                          Image courtesy of the U.S. Geological Su...
    digital_object_identifier:       https://doi.org/10.5066/P9OGBGM6
    landsat_product_id:              LC08_L2SP_218074_20190130_20200829_02_T1
    processing_level:                L2SP
    ...                              ...
    temperature_mult_band_st_b10:    0.00341802
    temperature_add_band_st_b10:     149.0
    reflectance_mult_band_8:         2e-05
    reflectance_mult_band_9:         2e-05
    reflectance_add_band_8:          -0.1
reflectance_add_band_9: -0.1Plot the composite#
scene.rgb.plot.imshow()
plt.axis("scaled")
plt.title(f"{scene.attrs['title']}\n{scene.rgb.attrs['long_name']}")
plt.show()