Fill missing values#
Landsat Level 2 data can sometimes contain missing values, particularly around
bright clouds with dark shadows. These pixels will have a value of
numpy.nan and can cause problems in other calculations. To fill them, we
can use the values of neighboring pixels to interpolate the missing values with
xlandsat.interpolate_missing.
Let’s use our sample scene of the December 2015 eruption of Momotombo volcano, Nicaragua, to demonstrate how it’s done. The Level 2 version of this scene has several holes because of the clouds and smoke from the volcano affecting the atmospheric correction method.
First, we’ll import the required packages and load the sample scene:
import xlandsat as xls
import matplotlib.pyplot as plt
import xarray as xr
import numpy as np

path = xls.datasets.fetch_momotombo()
scene = xls.load_scene(path)
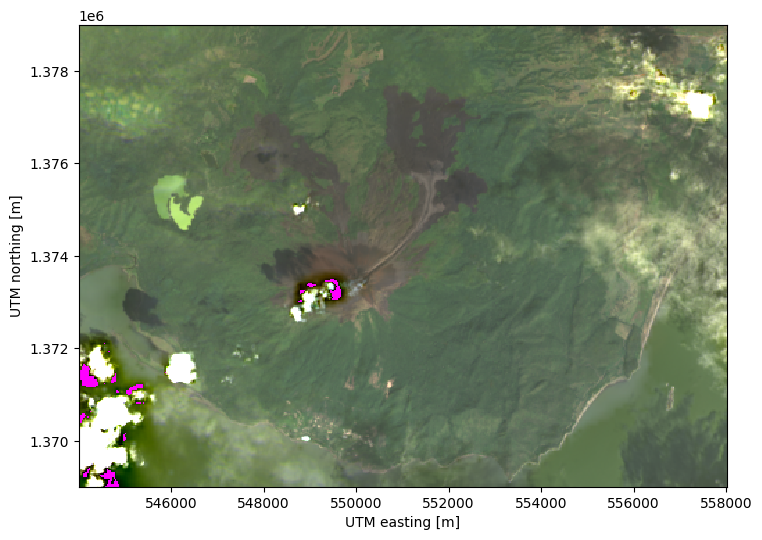
Now we can plot an RGB composite to show some of the missing values. In order to highlight them, we’ll color the background of the plot in magenta so that the missing values don’t simply show up as white:
# Make the composite and add it to the scene
rgb = xls.composite(scene, rescale_to=(0, 0.2))

fig, ax = plt.subplots(1, 1, figsize=(10, 6))

rgb.plot.imshow(ax=ax)

ax.set_facecolor("magenta")
ax.set_aspect("equal")

plt.show()
We can fill these values with reasonable estimates using interpolation:
scene_filled = xls.interpolate_missing(scene)

rgb_filled = xls.composite(scene_filled, rescale_to=(0, 0.2))

fig, ax = plt.subplots(1, 1, figsize=(10, 6))

rgb_filled.plot.imshow(ax=ax)

ax.set_facecolor("magenta")
ax.set_aspect("equal")

plt.show()
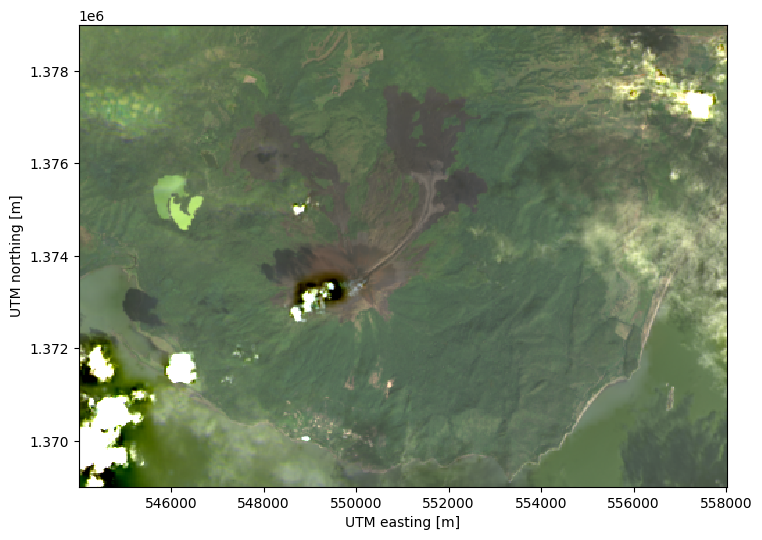
The interpolated scene no longer contains the magenta patches!
Warning
This method works well when the missing data are only a few pixels or small patches. Large portions of the image missing cannot be filled in accurately by interpolation.